
Abstract
Background: Chronic diseases such as type 2 diabetes place a large burden on the health care system and are associated with increased morbidity and mortality. A team-based multidisciplinary approach that organizes care to improve chronic disease management may actually decrease traditional continuity of care metrics. Visit entropy (VE) provides a novel measure of care organization produced by team-based approaches. Higher VE, reflecting more disorganized care, has been associated with more hospital readmissions. We hypothesized that higher VE was also associated with reduced adherence to the D5 quality criteria.
Methods: A retrospective study of 6590 adult diabetic patients in 5 established medical home practices was conducted. Multivariate logistic regression was used to determine if VE was associated with the dependent variable of D5 control. Separate models for usual provider continuity, continuity of care index, and sequence continuity were also constructed.
Results: Less organized care with a higher VE was associated with decreased odds of D5 control (odds ratio = 0.88; 95% confidence interval, 0.80 to 0.97). The other continuity measures were not significant. Age, education level, and initial HgA1c were significant covariates, but sex, race, endocrine consults, and Charlson comorbidity were not significant. The Number Needed to be Exposed to more organized care to produce 1 more controlled diabetic was 32.5.
Conclusions: More organized care reflected by a lower VE is associated with improved odds of D5 diabetic control. VE represents a better measure of care organization in team-based medical home environments than traditional continuity of care metrics.
- Chronic Disease
- Continuity of Patient Care
- Entropy
- Patient-Centered Care
- Primary Health Care
- Retrospective Studies
- Telephone
- Type 2 Diabetes Mellitus
Chronic disease, such as type 2 diabetes, places a significant burden on the health care system within the United States. Diabetes has an estimated prevalence of 12% within the US adult population.1 A diagnosis of type 2 diabetes confers a greatly increased risk of additional morbidity and mortality due to macrovascular and microvascular disease, as well as increased health care costs throughout a patient's lifetime when compared with patients who have never received a diagnosis of diabetes.2 Interventions targeted at preventing these complications have been shown to decrease the incidence of developing diabetes-related complications.2 Thus, the D5 was developed by the Minnesota Community Measurement organization to assess care quality in diabetic patients.3 It consists of 5 treatment goals: hemoglobin A1c (HgA1c) controlled (<8.0), blood pressure controlled (<140/90), statin use (unless contraindicated), tobacco free, and aspirin or other antiplatelet therapy (unless contraindicated). Meeting all 5 treatment goals has been associated with lower mortality, decreased hospitalizations, and fewer emergency department visits.4
It is well known that patient-level continuity of care, characterized by longitudinal relationships that foster communication, improve outcomes in patients with chronic diseases, including diabetes.5⇓–7 A majority of published studies use metrics to quantify continuity that either measure provider density (usual provider continuity [UPC]), sequence (Sequence of Continuity), dispersion (Continuity Of Care), or duration of visits. 7⇓⇓⇓⇓–12 The chronic disease model states that team-based care directed by primary care physicians is necessary to improve outcomes.13 Patient-centered, team-based care is rapidly being adopted by many primary care practices due, in part, to financial incentives.14,15 Such team-based care should be more organized than usual care because patients are actively directed by their primary care physician to needed resources and consults. The very nature of care teams, with inherent patient interactions involving multiple care team members, decrease longitudinal continuity as currently measured by conventional metrics.16
Visit entropy (VE) may provide a mechanism to characterize the quality of team care environments when conventional continuity metrics fail. VE, based on the concept of Shannon entropy from information science, quantifies the amount of unpredictability or disorganization in a patient's previous visit pattern to clinicians and is described in detail by Garrison, et.al.17 Because team-based care is organized care, it produces a lower VE. In fact, decreased VE (ie, more organized care) has been associated with reduced hospital readmissions in a patient centered medical home.18 We hypothesize that increased organization of care, measured as decreased VE, is associated with improved odds of meeting all the Minnesota D5 criteria among type II diabetics observed over a 3-year period.
Methods
A retrospective cohort study of all adult diabetic patients cared for in 5 primary care clinics in southeast, Minnesota was conducted to determine if continuity of care over a 3-year period influenced diabetic control. All 5 clinics are patient centered medical home practices with well-established care teams. Clinicians (physicians and advanced practitioners), registered nurses, pharmacists, social workers, and panel managers work together as a care team using an electronic registry to facilitate care of diabetic patients. When necessary, referrals are made to well-defined groups of community specialists.
Inclusion criteria were any adult patient (age >18 at 1/1/2015) who had at least 2 instances of an International Classification of Diseases, ninth revision (ICD9) or ICD10 code indicating type 2 diabetes mellitus and was not pregnant at any point during the 3-year study period of 1/1/2015 to 12/31/2017. A total of 8107 patients who had given permission for research review of their medical records were identified from an electronic clinical registry as meeting the inclusion criteria. Of these, 228 were excluded because they had fewer than 2 visits of any type and another 486 were excluded because they had fewer than 2 HgA1c values obtained during the 3-year study period. In addition, 803 subjects were 80 years or older and were excluded because diabetic treatment goals are often highly individualized in elderly patients.19
The study was reviewed and approved by the institutional review board. Data regarding the remaining 6590 subjects were electronically abstracted from the medical record, including demographics (age, sex, birthdate, race, language preference and, education level), diabetic control (HgA1c values, blood pressures, statin use, tobacco use, and antiplatelet therapy), Charlson comorbidities, and medical visits (visit date, clinician, and specialty). The D5 metric (controlled or uncontrolled) at the conclusion of the study period was defined as our primary endpoint and dependent variable. During the study period, the 5 elements of the D5 were defined as HgA1c controlled (<8.0), blood pressure controlled (<140/90), statin use (unless contraindicated), tobacco free, and aspirin or other antiplatelet therapy (unless contraindicated).
The scaling constant k used for maximum likelihood estimation in the calculation of VE was chosen to be the maximum number of different clinicians seen by any of the subjects (k = 102). For comparison purposes, UPC, continuity of care index (COC), and sequence continuity (SECON) were calculated as they represent other accepted measures of continuity of care. The mathematical definition of each measure is shown in Table 1 and was reviewed previously by Garrison et al.17
Continuity Metrics
Statistical analysis was conducted using R version 3.0.2.20 The highest education level achieved was imputed from demographic data by using a missing at random assumption for 1237 subjects who answered unknown or did not provide an answer to their education level in the medical record. Bivariate analysis was conducted using the χ2 test (for categorical independent variables), Wilcoxon rank sum (for nonnormally distributed continuous independent variables), or t test (for normally distributed continuous independent variables). P values less than .05 were considered significant. Multivariate logistic regression was conducted to assess the impact of the independent variables (age, sex, race, language preference, education level, Charlson comorbidity score, initial HgA1c, endocrine visits, number of visits, and VE) on the dependent variable D5. Odds ratios and 95% confidence limits were calculated with pr(> z) < 0.05 considered significant.
Results
A total of 6590 subjects were analyzed, of whom 3210 (48.7%) had a D5 that was controlled at the end of the study period. As Table 2 shows, bivariate analysis demonstrated that those with a controlled D5 were slightly older (61.7 vs 58.4 years, P < .001), had more years of formal education (P < .001), and had a lower initial HgA1c (7.2 vs 8.0, P < .001). They were also less likely to have seen an endocrinologist or an endocrine advanced practitioner (20.6% vs 23.8%, P = .002). Sex, race, primary language, Charlson comorbidities, and the total number of medical visits were not statistically different. VE was slightly lower (3.55 vs 3.59, P = .03) in those with a controlled D5. COC was also slightly higher (0.151 vs 0.145, P = .008), but UPC and SECON were not different.
Bivariate Comparison Between Controlled and Uncontrolled D5 Patients
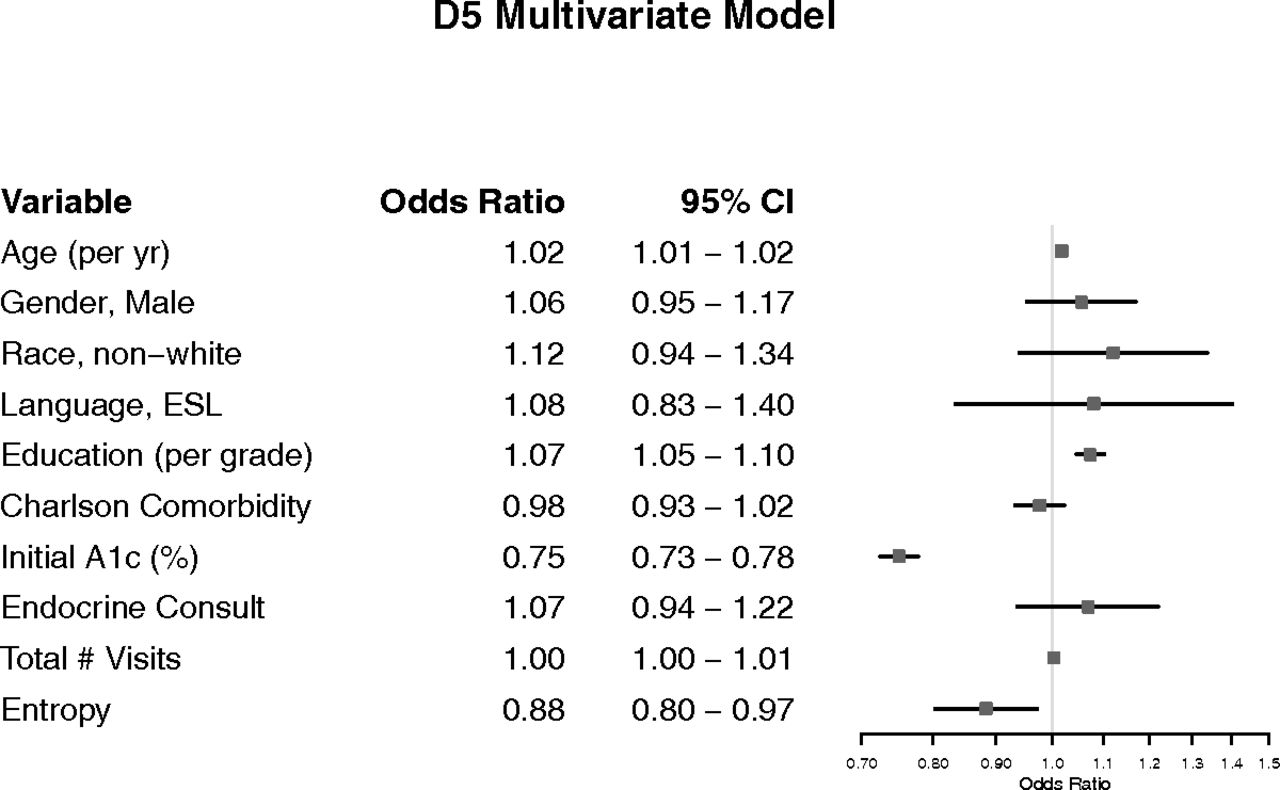
Results of the multivariate analysis are shown in Figure 1. The adjusted odds ratios for age (1.01; 95% confidence intervals [CI], 1.01 to 1.02), education level (1.07; 95% CI 1.05 to 1.10), and initial HgA1C (0.75; 95% CI 0.73 to 0.78) were significant. Less organized care, represented by a higher VE score, was associated with lower adjusted odds of a controlled D5 (0.88; 95% CI 0.80 to 0.97). Sex, race, primary language, Charlson comorbidities, presence of endocrine consults, and the total number of medical visits were not statistically significant. Additional models for UPC, COC, and SECON in place of VE as a continuity measure did not reach statistical significance (Pr(< z) = 0.46, 0.25, and 0.90, respectively). As seen in Figure 2, these other continuity measures have highly skewed distributions when compared with VE. Using the method of Bender and Blettner for multivariate logistic regression adjusted odds, we found that the Number Needed to be Exposed to this more organized care to produce 1 more controlled D5 is 32.5 patients.21

Factors associated with diabetic D5 control. NOTE: The other continuity measures (usual provider of care (UPC), Bice-Boxerman continuity of care index (COC), and sequential continuity of care index (SECON)) showed nonsignificant odds ratios that crossed 1.0 when run in separate models. CI, confidence interval; ESL, English as a Second Language.

Distribution of continuity measures. UPC, usual provider of care; COC, Bice-Boxerman continuity of care index; SECON, sequential continuity of care index.
Discussion
Our results demonstrate that decreased VE is associated with increased odds of a diabetic patient meeting all the D5 criteria (D5 controlled). This effect was independent of Charlson comorbidity score, age, education, and entry HgA1c, among others. VE can be thought of as quantifying the amount of unpredictability in a patient's visit pattern by using the prior probability distribution of that patient's visits. A more predictable visit pattern results in a lower VE. Highly functioning care teams should produce more organized and predictable visit patterns reflected by lower VE scores for their patients. In addition, VE can differentiate between planned referrals and unplanned subspecialty visits because unplanned visits make the visit pattern less predictable.
VE and COC (derived from Rae and Taylor's measure of political fragmentation22) both quantify disorganization of care across multiple providers. However, VE is more robust, as seen with the example visit patterns in Table 3. Clearly, pattern A has more organization and continuity than pattern B, and this is reflected in both VE and COC. VE correctly differentiates the lower continuity of pattern D compared with pattern C, but COC is unable to detect this difference in the number of visits to the primary physician. According to our results, the probability of a controlled D5 would be 47% lower for pattern B or D compared with pattern A or C [0.88/(1 + 0.88) = 0.47] due to the approximately 1-unit change in VE.
Example Visit Patterns Contrasting COC and VE
Other measures of continuity (COC, UPC, and SECON) did not demonstrate a similar association with controlled D5 in the multivariate model. As previously noted by Garrison et al7, these measures are all highly skewed relative to VE, which is approximately normally distributed. Furthermore, patients with less than 2 visits during the study period have to be removed to prevent undefined division-by-zero errors inherently present in the other metrics. VE does not suffer from this shortcoming and remains defined even with zero visits.
Quality measures are increasingly being collected, published, and used to determine reimbursement; thus, identifying office processes and care team structures that improve quality of care must be intentional within patient centered medical homes.23 A highly functioning cohesive team with physicians, nurse practitioners/physician assistants, pharmacists, care coordinators, and social workers should provide more predictable, organized care with a lower VE. Designing such high functioning care teams, as measured by VE, may be an important strategy to maximize quality measures for patients with diabetes.
Limitations
Because retrospective studies can only show associations, it is unclear whether interventions designed to reduce VE will lead to improved diabetic outcomes. The measured change in VE associated with beneficial results in this study was small and its magnitude depends on the choice of the scaling constant k. This study was conducted at 5 patient centered medical home sites within a single academic medical center; thus, results may not be generalizable to community medical practices nationwide. We arbitrarily choose the D5 composite metric as our endpoint. The D5 standard in place during the study period specified statin and aspirin use unless contraindicated for all patients. The recently published ACCORD trial and American Diabetes Association guidelines may alter these recommendations in the future.24,25 Finally, this study was focused on adults with type 2 diabetes and results may not be generalizable to other chronic disease states.
Conclusions
Lower VE representing more organized medical care is associated with improved diabetic control as measured by the D5.
Acknowledgments
We thank Ms. Julie Maxson and Ms. Alicia Meek for coordinating data collection.
Notes
This article was externally peer reviewed.
Funding: This project was supported by grant number UL1 TR002377 from the National Center for Advancing Translational Sciences (NCATS). Its contents are solely the responsibility of the authors and do not necessarily represent the official views of the NIH.
Conflict of interest: none declared.
To see this article online, please go to: http://jabfm.org/content/32/5/739.full.
- Received for publication January 23, 2019.
- Revision received April 7, 2019.
- Accepted for publication April 16, 2019.


