
Abstract
Objective: Practice facilitation is an effective approach to implementing quality improvement (QI) interventions in practice-based research networks (PBRNs). Regular facilitator-practice interactions are necessary for successful facilitation, and missed engagements may hinder the process of practice improvement. This study employs a mixed-methods approach to characterize the dynamics of practice facilitation and examine facilitation delays and barriers, as well as their association with the achievement of QI program goals in a PBRN initiative.
Methods: This study presents a secondary analysis of data from 226 primary care practices that participated in the Healthy Hearts in the Heartland (H3) initiative. We performed a time series analysis to identify delays in facilitation activities, and then qualitatively analyzed practice facilitators' notes (n = 4358) to uncover facilitation barriers. Finally, we assessed the relationship between delays, barriers, and QI intervention completion.
Results: While most facilitation activities occurred at regular, practice-specific tempos, nearly all practices experienced at least 1 delay. Practices with more delays had lower QI intervention completion rates. Practices with more delays were more likely to have encountered barriers such as lack of time and staff, lack of staff engagement, technical issues, and staff turnover.
Discussion and Conclusion: This study is the first to quantify irregular intervals between facilitation activities and demonstrate their negative association with project completion. The analytic method can be applied to identify at-risk practices and to accelerate timely interventions in future studies. Our delay detection algorithm could inform the design of a decision support system that notifies facilitators which practices may benefit from timely attention and resources.
- Cardiovascular Diseases
- Personnel Turnover
- Practice-Based Research
- Practice Facilitation
- Primary Health Care
- Quality Improvement
- Regression Analysis
- Time series algorithms
- Work Engagement
- Workforce
Introduction
While practice-based research networks (PBRNs) are increasingly recognized as integral to understanding and improving primary care in the United States, fostering such networks and implementing evidence-based interventions is often costly and challenging.1⇓⇓⇓–5 Translating clinical evidence and research ideas into successful primary care practice interventions requires careful tailoring to each unique practice environment and ongoing attention to practices' needs.2 In the last few decades, practice facilitation has emerged as a key vehicle for overcoming the hurdles associated with PBRN initiatives.6–7 Practice facilitators are trained individuals who provide support to primary care practices by acting as a liaison between individual practices and research institutions, and assist practices with the restructuring often necessary to participate in research and implement quality improvement (QI).6⇓⇓⇓⇓–11 Recent studies have shown that practice facilitators increase the likelihood of success of QI programs at the practice level,12–13 increase provider adherence to evidence-based guidelines,14 and improve care measures in diabetes management, cancer screening, and cardiovascular disease prevention.7,15
Effective practice facilitation requires sustained interactions between practice facilitators and primary care practices.16⇓⇓–19 Studies have shown that practices' time constraints pose major challenges to project completion.20⇓⇓⇓–24 Infrequent and irregular communication is associated with more miscommunication and discordant expectations between facilitators and practices.25 Long periods of no communication were found to be detrimental to intervention implementation in a recent regional QI initiative.26 Taken together, these results suggest that regular facilitator–practice interactions are an important contributor to effective practice facilitation. However, the tempo of facilitator–practice interactions has never been quantitatively measured, and its effects on project success are rarely known. Characterizing the optimal rhythm of practice facilitation activity could aid in development of improved decision support for facilitators to foster the sustained interactions with primary care practices crucial to successful project implementation.
Using retrospective data from the Healthy Hearts in the Heartland (H3) initiative, we conducted a time-series analysis to assess significant delays in facilitator–practice interactions in 226 small- to medium-sized primary care practices in Illinois, Indiana, and Wisconsin. As defined for this study, delays occur when the duration between 2 facilitation activities deviates from the practice's overall activity pattern. In addition, we qualitatively analyzed practice facilitators' notes to identify barriers to practice facilitation, and then evaluated the relationship between the delays, barriers, and QI intervention completion.
Methods
Study Design and Setting
H3 was part of the EvidenceNOW initiative, the largest study funded by the Agency for Health care Research and Quality dedicated to helping small- to medium-sized primary care practices improve cardiovascular care through practice facilitation. The H3 study was the Midwest EvidenceNOW collaborative, composed of primary care practices with fewer than 20 clinicians located in Illinois, Indiana, and Wisconsin. All participating practices were assigned a primary practice facilitator who received structured training on clinical topics and QI strategies related to the ABCS of heart health: Aspirin use in high-risk individuals, Blood pressure control, Cholesterol management, and Smoking cessation.
Primary care practices participating in H3 selected the QI interventions they wished to implement from a list of 35 offered intervention items (Appendix A). Examples of these intervention items included reminders to order aspirin for primary prevention in appropriate patients, orders/patient instructions/patient education for home blood-pressure monitoring, reminders to order prescriptions for patients with diabetes, and patient education on tobacco cessation. During a 12-month intervention period, practice facilitators deployed the interventions chosen by the practice and worked with staff to design and implement their QI plan.
Figure 1 illustrates the workflow of practice facilitation and the role of practice facilitators. In particular, practice facilitators aimed to conduct individual biweekly interactions (virtual or in-person meetings) with the assigned sites; trained clinicians and office staff on QI methods and tools that help implement the interventions; facilitated modifications to the site's electronic health records (EHRs) to enable systems support for ABCS measurement and monitoring; routinely engaged the practice site with data reports (eg, ABCS measures) so that monitoring performance becomes routine practice; extracted ABCS data and reviewed data with site staff; and documented intervention tracking surveys.

Workflow of practice facilitation in the Healthy Hearts in the Heartland (H3) initiative. Abbreviations: PF, practice facilitator; QB, QuickBase; NU, Northwestern University; ABCS, aspirin use, blood pressure, cholesterol, and smoking.
Data Collection and Study Participants
The study recruited 226 primary care practices, which were randomized into 1 of 4 waves that determined when they would start receiving the 12-month intervention. Participants in Wave 1 started from the first quarter of 2016; Wave 2 started from the second quarter of 2016, and so on. Thus, each wave began its intervention approximately 3 months apart. Full study details have been described by Ciolino et al.27 This study was approved by Northwestern University's Institutional Review Board. Table 1 shows the characteristics of the studied practices.
Characteristics of 226 Practices in Illinois, Wisconsin, and Indiana Participating in the Healthy Hearts in the Heartland (H3) Initiative across 4 Waves in 2016
Data Analysis
This study employed a mixed-methods approach combining time-series analysis, qualitative-content analysis, and regression analysis. Specifically, we first performed a time-series analysis to identify delays in facilitation activities, and then conducted qualitative-content analysis of practice facilitators' progress notes to uncover potential barriers to facilitation. Finally, we performed linear-regression analysis to assess the association between delays, barriers, and intervention completion rate (ICR).
Time-Series Analysis
Time-series analysis was employed to map out the patterns of facilitation activities and to identify delays between consecutive activities. Specifically, we used exponentially weighted moving averages (EWMA) to calculate the historic mean of interval between activities (IBA), which allows for detection of delays in a “real-time” setting. A delay occurs if the IBA deviates from the practice's normal pattern of facilitation activities. EWMA gives higher weight to recent data so that the more recent observations have greater influence on the averaging, thereby increasing the accuracy of delay detection. It detects not only rapid changes in the intensity of activities, but also small changes in the mean value realized through the gradual increase or decrease of the intensity of activities.28 EWMA has been used to detect signal mutation and design active fault-tolerant control systems.29 It has also been implemented in many public health surveillance systems and outbreak management systems.30⇓–32 EWMA was suitable for our analysis for 3 reasons: 1) gaps in practice facilitation activity are more influenced by recent activity, 2) detection of significant delays would be specific to each individual practice, and 3) EWMA would be easily implementable into a future decision support program. In this study, EWMA was applied in 2 steps.28
Step 1
We aggregated practice-facilitation activities on the practice level and then calculated the interval between activities (IBA) for each practice. EWMA computes a successive Z-score by computing the rational subgroup (7 activities) average IBA, and then combines the following subgroup average with the running average of following 7 IBAs. EWMA was calculated as:

In this formula, EWMAA is the historic mean of IBAs, YA is the measurement at activity A, and λ is the decay rate of past measurements, which empirically values between 0.2 and 0.3.33 We chose λ = 0.25 in this study.
Step 2
We utilized moving average Z-scores to detect delays.34 The Z-score was calculated based on the mean intervals of the previous 7 activities of residuals subtracted from the current estimate and divided by the standard deviation of the last 7 interval residuals as given by:

In this formula, I is the interval between activities and A represents activity. The conventional 1-sided Z-score was employed to generate delays.
We used the moving Z-score to identify 2 types of delays based on different thresholds: Type I Delay (Delay I) was based on Z-score > 1.282, which corresponds to a 1-tailed 90% confidence interval (CI). This means that a delay will be identified if the IBA deviates from the practice's normal pattern of facilitation activities. Type II Delay (Delay II) was based on Z-score > 1.645, which corresponds to a 1-tailed 95% CI. Delay II captures a larger deviation from the normal pattern compared with Delay I. Thus, Delay I was more sensitive to detecting delays than Delay II and could capture more instances in which infrequent facilitation activities occurred. We designed 2 types of Delays to increase the algorithm's flexibility to accommodate practice-specific needs, as practices likely have their own rhythm for engaging in QI program and facilitation activities based on their unique environments. Some practices may benefit most from facilitator meetings every week, while others may be more suited for monthly facilitator meetings. Since the facilitation activities were documented by facilitators in the system (ie, QuickBase), the Delay-detection algorithm could be embedded in the system to identify delays in practices.
Qualitative Content Analysis
We conducted a qualitative content analysis of facilitators' notes (n = 4358) to examine potential barriers to facilitation activities. Following Krippendorff (1980), 2 authors (JY and RZ) selected a random 10% sample (n = 436) of all the notes and independently coded them.35 This process generated 27 categories of barriers. Disagreements were resolved through rigorous discussion until consensus was reached. The intercoder reliability was 92.8% with a Krippendorff's α of 0.852, suggesting strong agreement. The 2 authors then grouped categories that were conceptually similar and developed a codebook encompassing 16 distinct categories (Appendix B). The remaining notes (n = 3922) were then evenly divided and independently coded by the 2 authors. The codebook was refined iteratively throughout the coding process. After completing coding, the research team met and discussed the results. Categories that lacked representation in the data were dropped, and similar categories were combined. The final 9 categories were selected to represent the most salient types of barriers.
Regression Analysis
We defined our outcome measure, the ICR, as the ratio of number of QI intervention items marked as “complete” over the total number of QI intervention items selected by a practice. Linear regression analysis was performed to examine the relationship between delays, barriers, and ICR.
It is important to note that the algorithm, as designed, detected delays in practices that had at least 7 activities. However, 14 practices withdrew from the project for various reasons and had less than 7 activities. Thus, these 14 practices were not included in the subsequent analysis of the associations between delays, barriers, and ICR.
Results
Our study population included 226 primary care practices that participated in H3. Across the 226 practices, a total of 4457 facilitation activities were recorded. The median ICR of practices was 64% (interquartile range [IQR], 0% to 94%). The median number of facilitation activities per practice was 18.5 (IQR, 12 to 25). The number of activities was significantly associated with number of QI interventions completed (β = 0.17, P = .005). Using practices in Wave 1 as an example, Appendix C shows that practices varied greatly in the tempo of facilitation activities.
Identifying Significant Delays
Overall, 401 Type-I Delays and 217 Type-II Delays were identified across the 4 waves (Table 2). The median number of Type-I Delays was 2 (IQR, 1 to 3), and the median number of Type-II Delays was 1 (IQR, 0 to 1).
Characteristics of Two Types of Delays across the 4 Waves with a 12-Month Period
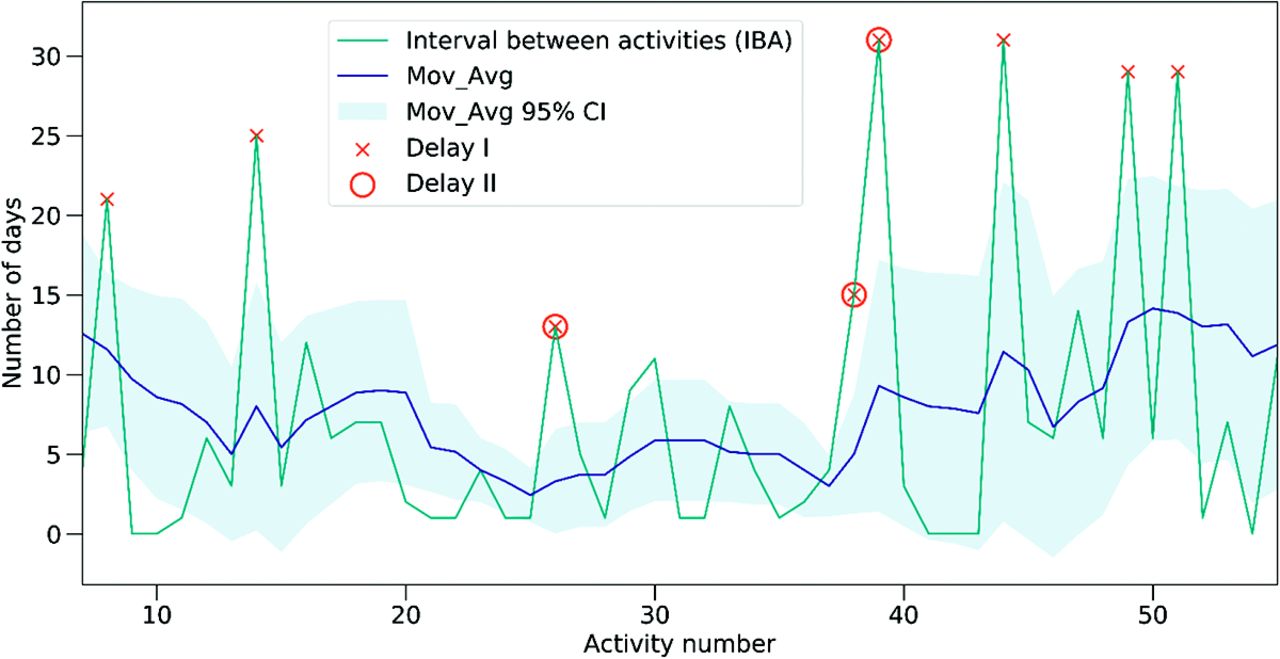
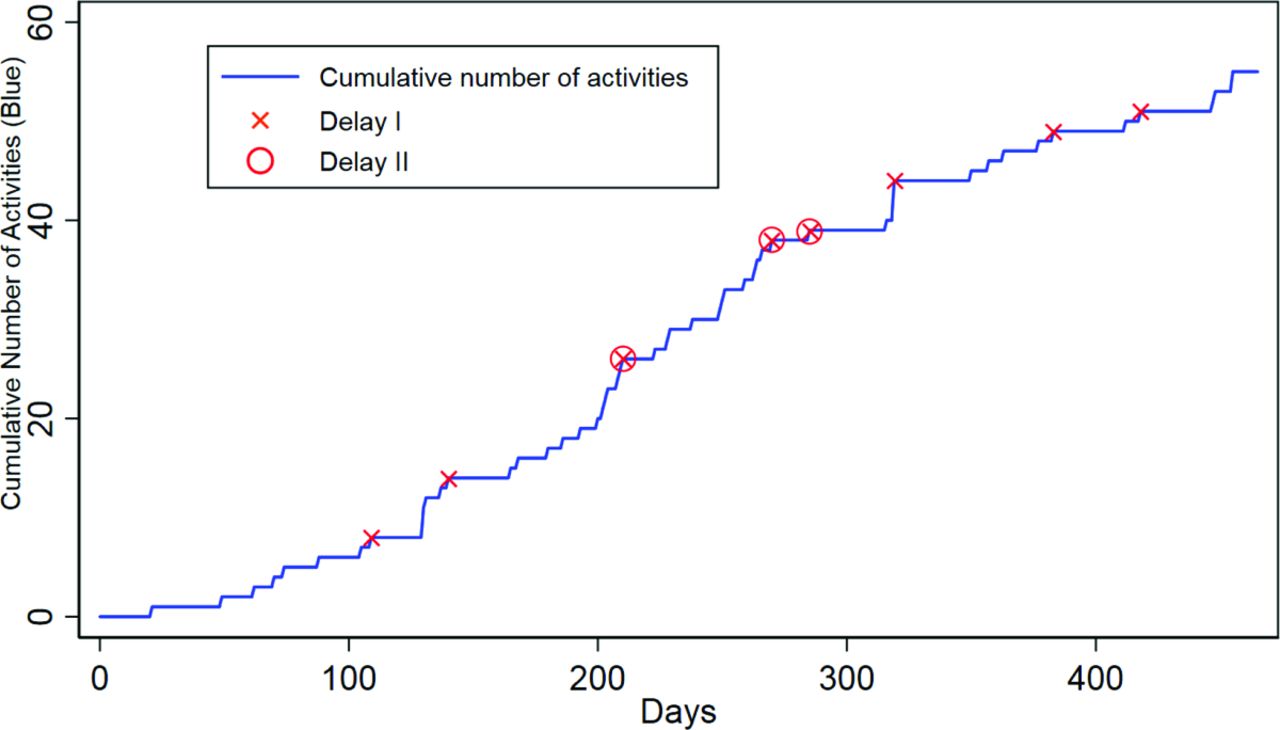
Figure 2 illustrates the occurrence of delays in practice #117 during the intervention period. A total of 8 Type-I Delays and 3 Type-II Delays were identified. As mentioned above, a delay was detected based on the interval between activities (IBA), that is, the number of days between 2 activities. We set the Y-axis to the number of days between activities so that the IBA can be better visually understood. If the IBA deviated from practice's overall activity pattern, a significant delay was identified. Namely, delay detection relies on the accumulated effect of a set number of observations. A temporary deviation may not trigger an alert. For example, if a practice was closed for a few days, the number of activities may plunge. However, if the practice resumed facilitation activities quickly enough to make up the reduced work, no delay was identified. Appendix D shows the occurrence of delays over the 12-month intervention period.

Example practice (#117) activities and delays. This Figure illustrates the mechanism by which the 2 types of delays are identified. If the interval between activities (IBA) is higher than the Z-score (described in Methods, Step 2), a delay will be detected. X-axis is the sequence number of each activity; Y-axis is the number of days between activities; Mov_Avg is the moving average results of IBA; Mov_Avg 95% CI is the 95% confidence interval of the Mov_Avg results.
Barriers to Practice Facilitation
Among the 4358 facilitator notes, 852 described barriers to practice facilitation. The final 9 categories of barriers can be further grouped into 2 domains: practice-related barriers (ie, challenges in the clinic environment) and implementation-related barriers (ie, challenges in implementation process). Table 3 describes the frequency and percentage of each barrier.
Barriers to Practice Facilitation and Quality Improvement Intervention (Source: Practice Facilitators' Notes)
Practice-Related Barriers
The most prevalent barriers pertained to issues within the clinic environment, such as staff, workflow, and technology. Notably, lack of time and staff accounted for 44% of documented barriers. Facilitators reported difficulties in scheduling QI activities with clinics due to high patient demand, personal issues of providers (eg, family emergency, vacation), and competing priorities (eg, conflicting programs). Moreover, some clinics were very small, with only 1 or 2 clinicians and a few staff. The shortage of staff prevented them from devoting more time to QI activities. For instance, a facilitator documented, “Busy solo provider who likes research but has limited time to meet for needs of the project” (Practice #25).
Lack of staff engagement was another salient barrier, accounting for 16% of total documented barriers. In particular, facilitators noted that some clinics were not fully engaged in or had limited interest in the QI program. Some clinicians were skeptical about certain intervention components, so they did not agree with or follow the guidelines. Another 16% of barriers were in the category of technical issues in the clinics. Specifically, due to the lack of EHR interoperability, EHR update, or EHR change, clinics often led to significant delays in QI activities, hindering the progress of interventions. Some facilitators also noted that clinics expressed concerns about data accuracy, as they discovered that “EHR mapping may be inaccurate” (Practice #123).
Staff turnover also disrupted facilitation activities in some clinics. Facilitators also noted workflow issues, such as clinical workflow disruption, collaboration inefficiency between practice staff members, and communication delays between facilitators and practices. For instance, a facilitator noted, “Unable to obtain cholesterol measure due to current workflow not tracking low-density lipoprotein [LDL] in discrete fields disallowing for chart abstraction” (Practice #109). In addition, 7% of barriers were noncategorical and labeled “other,” which included lack of infrastructure or low resources in clinics (eg, difficulty in arranging rooms or purchasing tools), patient issues (eg, patient nonadherence), clinic construction or renovation, and logistic issues (eg, survey mailed to the program got lost).
Implementation-Related Barriers
The second domain of barriers included issues in the implementation process. As Figure 1 shows, ABCS data were extracted either manually by facilitators, or electronically by an informatics specialist. Some facilitators encountered delays in data extraction from the informatics team, preventing them from reviewing data with the practice and revising improvement plans in a timely manner. Another roadblock was a lack of baseline data due to the delay of proper documents such as HIPAA Business Associate Agreement. A few practices reported they felt the interventions deviated from evidence-based guidelines.
Lastly, facilitators reported the lack of language diversity and health literary in intervention materials as a challenge. While the evidence-based tools were mainly in English, some clinics had a high proportion of patient populations who were non-English speakers, such as Spanish, Polish, and Russian, making it difficult to engage in the patients.
Relationships between Delays, Barriers, and ICR
Regression analysis showed that Type-I Delays were negatively associated with ICR (β = −0.113; 95% CI, −0.17, −0.05), suggesting that practices with more delays had significantly lower ICRs. Type-II Delays were not significantly related to ICR (β = −0.129; 95% CI, −0.22, −0.04). However, both Type-I and Type-II Delays were positively associated with barriers including lack of time/staff, lack of staff engagement, technical issues in clinics, and staff turnover (Table 4).
Regression Analysis of Barriers on Two Types of Delays
Discussion
Using data from a 12-month practice facilitation project in 226 practices, we found that while most facilitation activities occurred at a regular tempo, nearly all practices experienced at least 1 delay. Practices with more delays had significantly lower ICRs. In addition, practices with more delays were more likely to have challenges in the clinic environment, including shortage of time and staff, lack of engagement, EHR-related issues, and staff turnover. Our findings corroborate previous literature suggesting that significant or unexpected delays in practice facilitation hinder project completion.17,26
This study is the first to quantify irregular intervals between facilitation activities, and demonstrate their negative association with project completion. Our algorithmic approach based on machine learning allows for an automatic detection of facilitation delays, which can be applied to identify practices at risk of falling behind with program implementation and to accelerate timely interventions. It can inform the design of a decision support system that notifies facilitators when a delay occurs, helping them to design and develop a customized plan for practices. This automated method is more accurate, objective, and efficient compared with traditional observation and evaluation of practices by facilitators. While brief programs may rely on the astute practice facilitator, facilitation activities occurring over several weeks or months make it difficult to recognize delays without automatic alerts. Using an algorithmic approach could reduce the burden on practice facilitators to track practice engagements. This may allow them to focus on providing practices with tailored and timely support, and to manage numerous practices simultaneously.
Practice facilitation is most effective when interventions are tailored to each practice.2,14 Another strength of our algorithmic approach is that the delays identified are practice specific. An interval would be noted as concerning only if it significantly deviated from the practice's overall activity pattern. This quality makes our algorithm suitable for a decision support system used by facilitators who manage multiple practices and are implementing a practice-tailored facilitation strategy. Practices likely have their own natural rhythm for making progress in QI and research activities, based on their unique environment. Some practices may benefit most from facilitator meetings every week, while others may be more suited for monthly facilitator meetings. Decision support driven by our algorithm could be used to assist facilitators with sustaining momentum with practices with vastly different rhythms.
Moreover, while previous QI research has mainly focused on larger, well-resourced institutions,36⇓⇓–39 less attention has been paid to smaller primary care clinics, which account for nearly half of all primary care settings in the United States.40 Our qualitative analysis of facilitators' field notes revealed a number of barriers to practice facilitation specific to small- and medium-sized clinics. Our findings align with previous work that found small practices often lack staff and resources to invest in infrastructure and training that are essential elements of QI capacity.41 In addition, they usually cannot afford the time to learn new evidence-based guidelines while navigating new health information technology.42,43 While prior research has identified communication delays between facilitators and practices as a salient barrier in QI initiatives,26 they did not occur very frequently nor predict facilitation delays in our study. Given the unique conditions and needs of small practices, creative and tailored solutions become all the more important.18
Limitations
This study has several limitations. First, since the facilitation activities we analyzed were documented by facilitators, the documentation process may be subject to human error, including incomplete and missing documentation. In addition, facilitators did not receive uniform instructions on standardized documentation. Future study is necessary to determine the degree of ascertainment. Second, we set the threshold as 7 for the EWMA to detect delays, so the algorithm was only able to detect delays in clinics that had at least 7 activities. While all the practices had more than 7 activities (except for those that withdrew from the study), the automated method is limited in its ability to identify measurements with small errors and thus may cause bias. To benchmark the performance of the delay detection algorithm, further research needs to measure both training and validation data and the performance of signal detection under specific conditions.
Third, this study focused on PBRN-based practices in the Midwestern United States. All identifiable information about the practices, including PBRN-related descriptors was stripped in the dataset. Thus, we do not know whether a practice was from a PBRN, or the proportion of practices that were members of a PBRN. Future research should examine whether our findings and the methodological approach could be applied to other clinical settings outside the H3 initiative. Fourth, since we evaluated barriers based on facilitators' notes, the identified barriers were mainly on the practice side. However, we recognize that there might be issues with practice facilitators such as lack of accountability or expertise. More research should examine facilitator-side barriers by conducting interviews with practices (eg, McHugh et al12).
Conclusion
This study employed a mixed-methods approach to identify practice-specific delays between facilitation activities and barriers to facilitation in a 12-month PBRN QI initiative that included 226 small- and medium-sized practices. Delays had a negative impact on QI intervention completion, and also indicated the presence of challenges such as problems with clinic staffing and technical issues. This study demonstrated the importance of a regular tempo in practice facilitation activity and propose a framework for designing a decision support system to encourage sustained facilitator-practice interactions.
Acknowledgments
We thank the practices and practice facilitators who participated in this study.
Appendix
Practice Intervention Tracking Items
Appendix
Codebook for Qualitative Analysis
Appendix C. Wave 1 Practice Activity Trend (in Descending Total Number of Activities)
This Figure shows the trend of the number of daily activities (red) and cumulative number of activities (blue) in each practice of wave 1 during the study course. To ensure the anonymity of the practices in this study, each practice in the Figure was assigned a pseudonymized number ID.
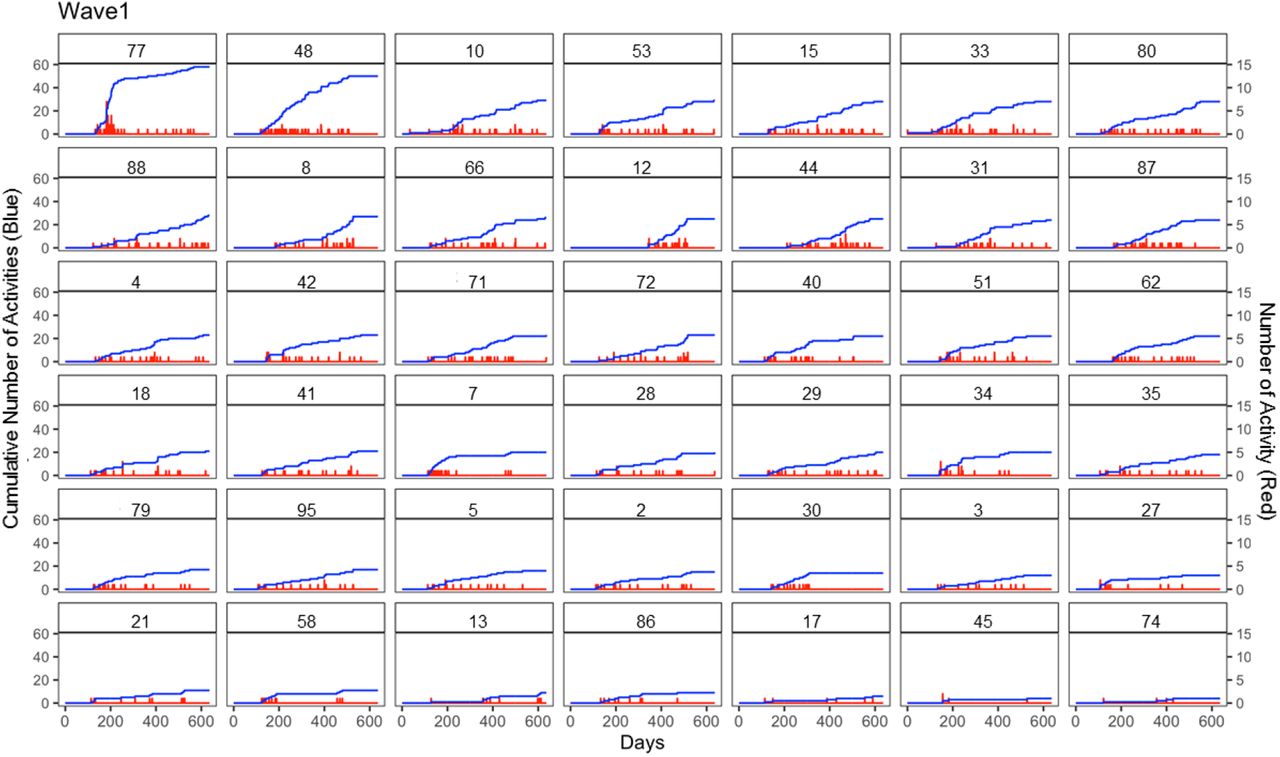
The blue line presents the cumulative number of activities over time, while red line presents the daily activity number trend, a higher signal strength present a larger amount of activities. The X-axis presents the days within the project, since the start day for each practice was not aligned with date of recruitment or date of intervention start, some practices were also lagging in survey collection and close out meeting, so the X-axis ranges from 0 to 600.
Y-axis (left) presents the activity cumulative number, and Y-axis (right) presents the activity number. The number in the subgraph presents the pseudonymised practice IDs, and all 42 subgraphs were sorted by descending the total number of activities.
Appendix D. Occurrence of Delays over the Intervention Period (Example Practice #117)

Notes
This article was externally peer reviewed.
Funding: This research was supported by Agency for Healthcare Research and Quality through Grant No. R18HS023921.
Conflicts of interest: None.
To see this article online, please go to: http://jabfm.org/content/33/5/655.full.
- Received for publication January 31, 2020.
- Revision received May 11, 2020.
- Accepted for publication May 26, 2020.
References
In this issue


Jump to section
Related Articles
Cited By...
- What AHRQ Learned While Working to Transform Primary Care
- The Effects of Major Disruptions on Practice Participation in Facilitation During a Primary Care Quality Improvement Initiative
- The Most Frequently Read Articles of 2020
- Improving the management of type 2 diabetes through large-scale general practice: the role of a data-driven and technology-enabled education programme
- The Changing Face of Primary Care Research and Practice-Based Research Networks (PBRNs) in Light of the COVID-19 Pandemic