
Abstract
Background: For decades, researchers have utilized paper card studies to assess primary care clinician (PCC) perceptions across various clinical and practice topics. Since 2022, cards can be completed electronically through the electronic health record (EHR) or a novel smartphone application (app). These delivery modalities have not previously been evaluated head-to-head. We report findings from a work in progress comparing paper, EHR, and app-delivered cards.
Methods: The Northern New England CO-OP Practice and Community Based Research Network recruited 15 PCCs from 3 clinics to collect a total of 324 cards from unique patient visits over 4 clinical days per PCC on the topic of “telehealth burden.” Each clinic utilized a different data collection modality and collected approximately 100 cards. After completing the cards, we surveyed PCCs about their user experience. Our primary outcomes were PCC experience, card completion rates, and total cost of using the cards.
Results: PCCs reported that data collection was easy and the card study did not disrupt clinical operations regardless of modality. Paper cards had the highest completion rate and were least expensive for a small-scale card study, but were most expensive when scaled due to the large amount of time to transcribe data manually. EHR was the most expensive modality for a small-scale card study, but EHR and app cards scaled better than paper.
Conclusions: While each modality has distinct advantages and disadvantages, all 3 card study data collection methods were acceptable to PCCs and obtained a high response rate.
- Data Collection
- Family Medicine
- New England
- Physicians
- Practice-Based Research
- Practice-Based Research Networks
- Primary Health Care
- Research
- Research Design
Introduction
For decades, researchers have used card studies to obtain observational data at the point-of-care (POC) to assess a variety of clinical and practice topics.1⇓–3 Card studies have been influential in changing clinical standard of care; examples include reduced use of computed tomography imaging after new onset headache and increased use of clinical observation instead of dilation and curettage following spontaneous miscarriage.4⇓–6 Traditionally, cards were printed on heavy-stock paper with 3 to 6 questions, taking less than 3 minutes to complete at the POC. Working with a practice-based research network (PBRN), researchers could distribute data collection to many PCCs to gather thousands of cards quickly, sometimes in a few weeks. An individual PCC would typically complete only 10 to 20 cards (1 or 2 days of data collection), minimizing the disruption in clinic. Sampling from many PCCs and clinics captures variation across geography, clinic business model, population served, and other factors. Card studies are distinct from clinician surveys: card study questions focus on interactions with specific patients and encounters at the time of data collection. Collecting near-real-time data at the POC eliminates recall bias.1
Although paper cards are easy to use, they have costs including materials, printing, postage, manual data entry, and staff time – as well as logistic constraints such as card storage and transfer, and manual skip patterns in data collection. These constraints can result in data collection and transformation errors and longer response times. In 2022, Bunce and colleagues demonstrated the feasibility of embedding card questions into a single Epic-based electronic health record (EHR) with responses saved into the EHR database.2,7 They reported that time and specialized effort were required to program the EHR prompts, but data collection was simplified for both the researchers and participating PCCs.2 In 2023, software developers released a smartphone application (app), in collaboration with an author, designed to collect anonymous data from PCCs and upload responses to a secure, research database.8 The app is free to users and certified HIPAA compliant.8
Paper, EHR, and app card modalities have inherent advantages and disadvantages. Paper cards require no technology investment but require more labor. EHR methods require specialized programming affecting clinical workflow, so require institutional approval and access to scarce resources. Deployment across multiple EHR vendors introduces further challenges. An advantage of the app is the ubiquity of smartphones. To date there has not been a study reporting on the Smart Measures Card Study App or directly comparing 3 approaches of data collection at the POC.
We compared these 3 modalities for obtaining POC card study data from PCCs as a pilot across 3 primary care clinics to learn more about the impact of telehealth on rural clinicians, a common concern in health care.9,10 Our outcomes were: 1) card completion rates, 2) PCC perceived ease of use and likelihood of participation in future card studies, and 3) the cost to deploy the technology, collect responses, and manage the data during the current study, as well as projected costs for a larger study.
Methods
The study was conducted in the Northern New England CO-OP Practice and Community Based Research Network (NNE CO-OP PCBRN), with clinics in Vermont (VT), New Hampshire (NH), and Maine (ME). The NNE CO-OP PCBRN is administered by the Department of Community and Family Medicine at Dartmouth Health (DH), in partnership with the University of Vermont Health Network and MaineHealth. The NNE CO-OP PCBRN team contacted clinical leaders at network sites to solicit volunteers for this study. Based on convenience, we selected 5 to 7 PCCs from 3 clinics: a Federally Qualified Health Center in VT, an academic health center in NH, and an academic health center in VT. Clinics received $250 at study completion, and PCCs were not individually compensated. DH Institutional Review Board (IRB) granted a waiver of consent (#02001810) for all study activities; participation was voluntary and the PCC survey included consent.
Each PCC completed: 1) a study card for 25 to 30 patient encounters, and 2) a follow-up survey about PCC experience using their assigned card method. For patient encounters, the qualifying criteria were PCC participation and study dates. Most PCCs completed 1 card for each consecutive visit over 3 to 4 days. The anonymous follow-up surveys were created in Research Electronic Data Capture (REDCap),11,12 and sent to PCCs’ e-mail. We aimed to complete approximately 100 cards in each of 3 clinics.
Card modality assignments: Each participating clinic was assigned a different card method for convenience. The VT clinic had experience with paper cards and agreed to that modality. The DH clinic had EHR analysts available to configure the Epic Best Practice Advisory (BPA) and REDCap link. The academic health center in VT agreed to trial use of the smartphone app.
Card Study Modalities
Paper Cards
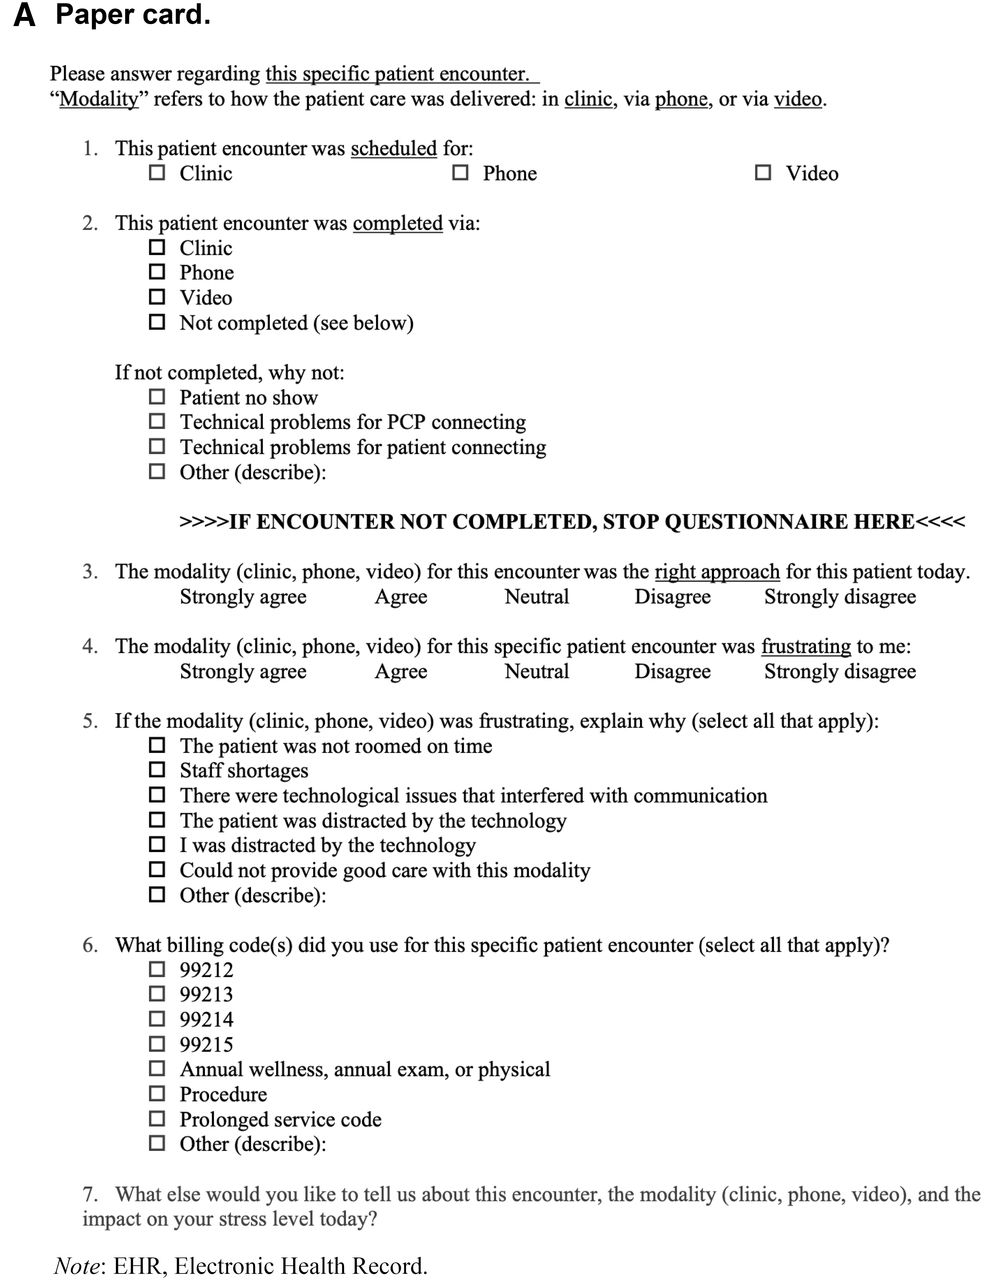
Research staff distributed preprinted cards (Figure 1A) to participating PCCs who returned completed cards to a box in the clinic. NNE CO-OP PCBRN staff brought completed cards back to the researchers. One researcher transcribed the card data into Excel, and a second researcher double-checked the data.

Examples of the 3 card methods: paper, EHR, and app. The questions on the cards are shown as an illustration of how cards are used, and responses to the card questions are not evaluated in this manuscript.

Continued

Continued

Continued
EHR
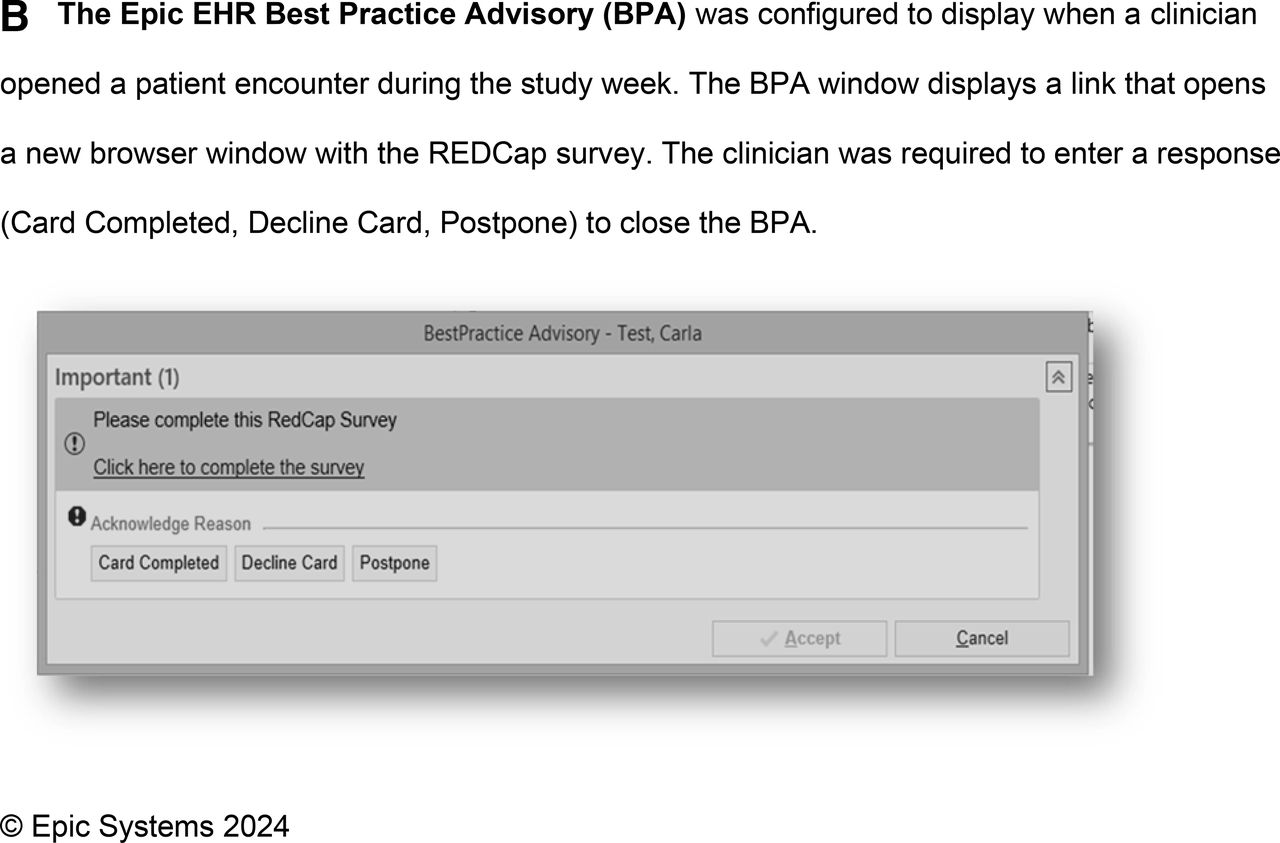
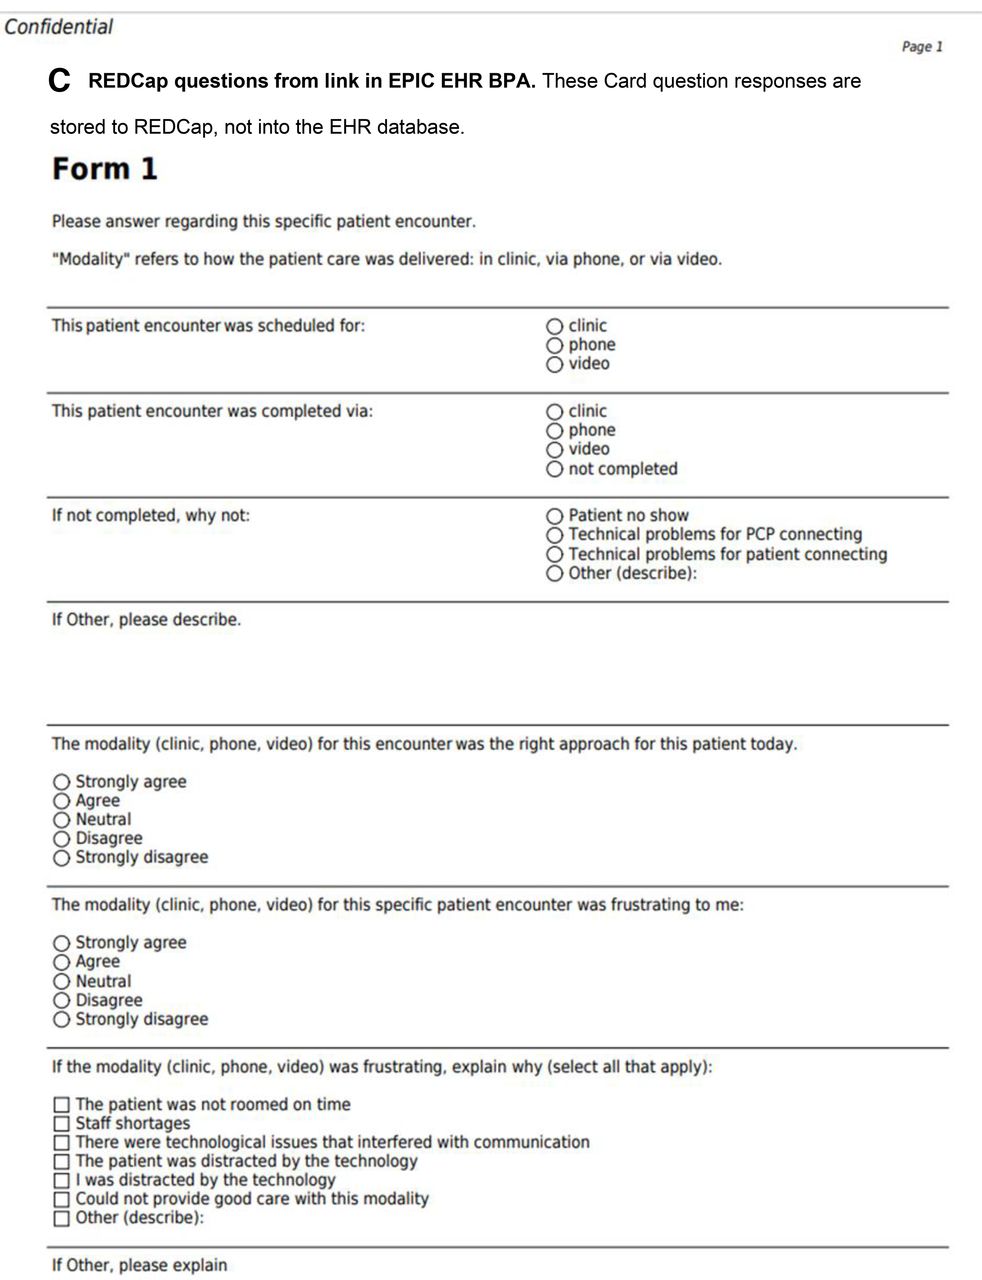
We combined Epic EHR (Epic Systems, Verona, WI) BPA and REDCap11,12 (Vanderbilt, TN) functionality. Only when a PCC opened an eligible encounter in Epic, the BPA appeared, including a link (Figure 1B). The link opened a browser with REDCap, displaying the card questions (Figure 1C). Card responses were stored to the REDCap database, not the EHR. No information left the EHR. The PCC was required to enter a response (Card Completed, Decline Card, or Postpone) to close the BPA. “Card Completed” or “Decline Card” closed the BPA window in the EHR and turned it off for that encounter. “Postpone” closed the BPA until the encounter was reopened, for example if the PCC wanted to complete the card at the end of the day.
App
The Card Study app (v1.0.29), owned by The Larry A. Green Center, was conceived by Case Western Reserve University and the Center for Community Health Integration.8 It is a HIPAA-compliant platform developed by TechNeed LLC (Hopewell, NJ), available on iOS or Android devices to researchers at no charge. NNE CO-OP PCBRN researchers configured the app card questions. PCCs downloaded the app on personal smartphones. TechNeed staff added PCC e-mail addresses to the system to invite participants. After each encounter, PCCs entered card responses using the app (Figure 1D). The app does not have any phone notifications or reminders; PCCs had to remember to complete a card after each encounter. Card responses were transmitted digitally to the app database. NNE CO-OP PCBRN researchers downloaded responses from the database as a CSV file and loaded responses into Excel.
Measures
Card completion rates
For each modality, we calculated completion rates as the number of cards completed divided by the number of encounters per PCC during the study dates.
PCC Experience
PCC responses to card questions measured clinical appropriateness and frustration with encounter modality (in-clinic, telephone, or televideo) using a 1 to 5 Likert scale. The follow-up survey measured PCC experience with the card method. Clinician responses for the baseline and follow-up survey were on a Likert-like scale from 1 to 100.
Financial Costs
We recorded staff hours and pay rates for each task associated with setting up and deploying cards. For paper cards, we included time for formatting, printing, delivering, and collecting the cards from the sites, and manually transcribing card responses into Excel. For EHR cards, time included building the BPA, creating the REDCap survey, downloading data from REDCap, and cleaning data in Excel. The app tasks included programming the questions, collecting and entering e-mail addresses, helping PCCs set up the app on their individual phones, downloading data from the app database, and cleaning data in Excel. We excluded time for initial development of the app software and tech support from TechNeeds staff. We estimated costs for a study involving 400 cards per arm using fixed costs (eg, building the REDCap survey cards) plus incremental costs of each additional user (eg, manual data entry from paper cards).
Data Analysis
We aggregated PCC demographics across clinics due to small sample size to maintain anonymity. All card data were collated into one Excel file, then imported into SAS v9.4 for analyses (SAS Institute Inc., Cary, NC). Participant characteristics were summarized using descriptive statistics. PCC responses were anonymous, so postsurveys were not linked. This design decision, along with the small sample size, did not allow for clinician characteristic adjustment with the study outcomes.
We used a Kruskal-Wallis Test to analyze the difference in PCC experiences, in non-normally distributed data, across card study modality (paper, EHR, and app). If there were statistically significant differences in the mean rank scores by the independent variables, we conducted a post hoc Mann-Whitney U test for pairwise comparisons.
Results
Demographics
Fifteen PCCs completed the baseline survey, mostly identifying as women (80%), <50 years of age (53%), and physicians (80%) (Table 1). Respondents were evenly distributed in number of years as a PCC. One-third of PCCs reported <=16 clinical contact hours per week.
Primary Care Clinician (PCC) Demographics (n = 15)
Card Completion Rates
Combined completion rate was 86.3% (278 cards completed in 322 encounters). Paper and EHR cards had a 100% and 71% completion rate, respectively. The app completion rate was 97%, based on 3 of the 5 PCCs with known number of encounters (ie, known denominator).
PCC Experience with the Card Modality
Eighty percent of PCCs completed the follow-up survey: 3 of 4 PCCs using paper cards, 5 of 6 PCCs in the EHR cards arm, and 4 of 5 PCCs using the phone app (Table 2). On a Likert scale ranging from 1 (strongly disagree) to 5 (strongly agree), PCCs agreed that the card study did not disrupt clinical operations or patient care (mean = 4.2, SD = 0.6) and card method they were assigned was easy to use (mean = 4.3, SD = 0.8). PCCs felt good about participating in this study (mean = 3.8, SD = 0.9) and want to participate in future card studies (mean = 3.8, SD = 0.8). On a scale of 0 to 100 (100 = strongly recommend), PCCs recommended the card study methodology for another project (mean = 73.0, SD = 14.1). There were no significant differences in PCC satisfaction among card methods (paper, EHR, or app).
Primary Care Clinician (PCC) Participant Experience from the Follow-up Survey, by Card Modality (n = 12)
Financial Costs
For small projects (∼100 cards), paper cards are efficient and inexpensive, totaling $795 (Figure 2). The cost of manual data entry likely increases dramatically at scale, resulting in paper being the most expensive option with 400 cards (ie, $4109). The EHR cards had the highest initiation cost for 100 cards ($2200) due to EHR analyst time, but likely scales well as the work is easily replicable, resulting in a similar cost for 400 cards ($3700). The app set up and data management were moderately expensive for the small project due to training and supporting PCCs (ie, $1354), but the method likely scales well as data management in REDCap is simple, resulting in the least expensive option of $3167 for 400 cards.

Cost of card development and data managing by card modality. Development and deployment costs based on paper (copying, distributing, and collecting paper cards), EHR (building the alert in EHR and questions in REDCap), and app (adding questions and primary care clinician e-mail addresses, supporting users with app download). Data management and tech support costs based on paper (manual data transcription from paper to Excel), EHR (download data from REDCap, upload and data cleaning in Excel), and app (clinician support, onboarding, download data from app, upload data in Excel). For each modality the column on the left indicates actual, measured cost for this study. The columns on the right for each modality indicate the estimated cost for using 400 cards per modality. The paper cards do not scale as well due to large amounts of time required to transcribe data manually. EHR and app cards scale much better with minimal increase in data management time.
Discussion
Card studies remain a valuable research method for understanding symptom and disease prevalence, clinician experience, and POC decision making. Our pilot offered an opportunity to test 3 different methods for collecting card study data. Regardless of the card method (paper, EHR, or app), PCCs completed cards at high rates (average 86%) and recommend using it again. Despite limited sample size and nonrandomized allocation, each method has clear advantages and disadvantages based on the type of clinical question, research team capacity, resources, and clinical setting.
Paper cards, used for decades in PBRNs, remain a very useful method. Paper cards are easy to implement and can be done without much technical support. Although card studies are intended to collect anonymous data, in the rare instance that patient or clinician identifiable data are collected, HIPAA compliance and data security would require extra care when collecting the surveys in a physical location within a clinic. Manual double-data entry likely becomes more expensive at scale and should be considered in large card studies.
Our experience to date suggests that EHR-based cards might be ideal for PBRNs within large health systems with multiple clinics using a shared EHR, although further evaluation is needed. A single EHR provides a platform that allows integration of a survey into the electronic infrastructure and clinical workflow, confirming the results of Bunce et al.2,7 Once integrated, the EHR would be capable of delivering cards to dozens, or even hundreds, of PCCs without incremental work. When combined with the EHR, REDCap has benefits for survey creation and database management. However, not every EHR has a way to link to an external REDCap website. The EHR-REDCap method had higher initiation costs due to the upfront investment in developing the technical infrastructure. Once the EHR-REDCap link is standardized, additional card studies or clinicians could be quite efficiently incorporated. We anticipate that the EHR card study cost will scale well due to ease of data management in REDCap, making it desirable. The configuration of the BPAs to trigger PCCs to complete a card created some frustration, perhaps contributing to lower card completion rates. We could mitigate this problem by adjusting the BPA triggers in future studies. The EHR has an advantage over paper and app cards because 1) the BPAs can remind PCCs to complete a card, and 2) the BPA and the card questions can be limited to specific encounters based on eligibility criteria, including encounter types and patient characteristics. REDCap questions can be built with complex logic and skip patterns, not possible on paper or the card study app.
The app provides a secure infrastructure that can be readily deployed in many different clinic settings. The app provides a standard format for entering data about participating PCCs, individually or in bulk, by uploading an Excel file of PCC e-mail addresses. This list can be customized for specific card studies and saved for future research. The app may be particularly good for clinics with limited EHRs such as direct-primary care clinics, or independent clinics with less EHR support. The app offers a secure data collection tool when EHRs are not readily available for research. The current app version was designed for simplicity and does not offer question skip patterns, so the survey may be confusing or unnecessarily long in some cases. Future versions of the app might offer skip pattern questions. Adding the app to a smartphone and using the phone during patient care can be deterrents for some busy clinicians. Once the card study and participants were set up, PCCs were happy with the app. The app had very high card completion rates and data management was simple. The app likely increases costs at scale due to user support, however data management costs will probably remain very low. The app offers the broader PBRN research community a location to store and share surveys across PBRNs, supporting collaboration and comparison.
All 3 modalities were cost efficient and well accepted by practicing clinicians. The advantages of each modality and the scale of the study may impact when and where the modality is selected for card study survey research. Ongoing research may identify additional advantages and disadvantages.
This is the first study to examine a card study app for POC data collection. This method was novel and therefore, may have required additional time for system start up, which would not be necessary for future studies. While the app was beta tested before general release, there may be additional development requirements to make this card study data collection tool widely useable. The app is free but, should this change, the cost to use the app for data collection would be higher than presented in this study. With respect to BPA alerts, if a health care system uses a lot of BPAs resulting in BPA fatigue, this might not be a useful card study modality despite convenience, as clinicians in that type of setting would be likely to skip the BPA. Despite the potential to introduce bias, we opted for a convenience assignment of card modality because this was exploratory research of a new data collection methodology and we needed to ensure that the modality worked within current clinical workflows. Future scaled card studies will randomize sites to assignment of data collection modality to reduce potential selection bias, increase generalizability of findings to the population of PCCs, and begin to fill a gap in the literature on this topic.
Conclusion
All 3 card study data collection methods were effective, acceptable to PCCs, and obtained a high-response rate. Large systems with common EHRs might more easily be able to take advantage of the EHR method, while independent clinics might prefer the paper cards for smaller studies and the smartphone app for larger projects. While each card method has distinct advantages and disadvantages, researchers may feel comfortable using any one of the methods for card study survey research. Additional research using the 3 modalities may shed light on additional benefits and unique clinician or practice characteristics to help match a particular card study method with a specific setting.
Acknowledgments
We thank the participating clinical sites and their dedicated teams of primary care clinicians for their invaluable contributions in collecting the anonymous data that made this study possible. Their commitment and collaboration have been essential to the success of this research.
Notes
This article was externally peer reviewed.
This is the Ahead of Print version of the article.
Funding: This study was funded from the NIH/NIGMS NNE CTRN Pilot Award (U54GM115516).
Conflict of interest: None.
To see this article online, please go to: http://jabfm.org/content/00/00/000.full.
- Received for publication May 20, 2024.
- Revision received July 8, 2024.
- Accepted for publication July 15, 2024.
In this issue


Jump to section
Related Articles
Cited By...
- No citing articles found.