
Abstract
Background: Despite the high risk of adverse drug events associated with potentially inappropriate medications (PIMs), primary care physicians (PCPs) continue to prescribe them for the elderly. The objective of this study was to explore PIM prescribing behavior in relation to characteristics among PCPs practicing in the United States.
Methods: We conducted a retrospective cohort study of PCPs in the 2013 to 2015 Medicare Part D Public Use File. We obtained physician characteristics from the 2015 American Medical Association (AMA) Masterfile. For each PCP, we calculated the ratio of primary care-relevant PIM claims to all drug claims (PIM rate) based on Beers Criteria. We used a multivariate regression model to assess the associations between physician characteristics and PIM rate.
Results: The study sample contained 111,461 PCPs who specialized in family medicine, internal medicine, general practice and geriatric medicine. Although the mean PIM rate was low at 4.9%, it varied widely across PCPs with the bottom quartile at 1.2% and the top quartile at 10.1%. PCPs in the top quartile were on average older, more likely to be male, have a DO degree, practice in the South, and have a smaller Medicare patient panel. A multivariate analysis confirmed that even after adjusting for patient panel characteristics, physician characteristics including gender, age, professional degree, specialty, practice location, practice size, and patient panel size were associated with PIM rate.
Conclusion: Identifying PCPs with higher PIM rates can guide future interventions to increase safe prescribing for elderly populations.
- Adverse Drug Event
- Geriatrics
- Internal Medicine
- Medicare Part D
- Multivariate Analysis
- Potentially Inappropriate Medications
- Primary Care Physicians
- Primary Health Care
- Retrospective Studies
Introduction
Ensuring medication safety for older adults is a top public health priority, yet adverse drug events (ADEs) continue to be a common complication in the outpatient setting. ADEs are associated with increased morbidity, mortality, health care resource utilization, and health care expenditure.1⇓⇓⇓⇓⇓–7 According to recent studies, in the ambulatory setting, ADEs account for 3.5 million office visits,5 over 700,000 emergency department visits, and over 100,000 hospitalizations annually.6 Of the ADEs that occur in the primary care setting, 27% are estimated to be preventable.7,8 Risk factors for ADEs in the elderly include multiple comorbidities,8,9 altered drug metabolism associated with advanced age,10 polypharmacy,11 and potentially inappropriate medication (PIM) use.8,12 PIMs are medications associated with a potential increased risk to benefit ratio in the elderly.13,14 In 2001, an estimated $7.2 billion in health care expenditure was attributed to PIM use in community-dwelling elderly patients.15 Therefore, interventions targeted toward reducing PIM use for geriatric patients are vital to improve quality of care and reducing health care costs.
As a means of improving prescribing practices for the elderly, the American Geriatric Society (AGS) released Beers Criteria, which defines PIMs as medications that may have increased risks for drug-disease interactions, additional adverse events, or may have safer alternatives available.16 Using Beers Criteria, primary care physicians (PCPs) can reduce polypharmacy and PIM usage through safe prescribing practices such as medication reconciliation, deprescribing and careful prescription selection.17 Despite accumulating evidence regarding ADEs, PIMs continue to be prescribed for the elderly.18,19 A prior study had calculated the prevalence of PIMs in the primary care setting to be 23%.17 Identifying physician- and practice-level characteristics associated with higher PIM prescription rates in the primary care setting may be helpful to understand drivers of continued PIM use and guide future interventions to improve appropriate prescribing behavior. Multiple studies have assessed the association of PIM prevalence with patient and physician characteristics.4,11,20⇓–22 There are a few studies that describe the association between PCP prescriber characteristics and PIM prescribing behavior but all were conducted under limited geographic settings.17,21⇓–23 However, none have evaluated the association between physician characteristics and PIM prescription rates in the outpatient setting among PCPs at the national level.
Materials and Methods
The objective of the current study is to explore the variability in PIM prescribing behavior as they relate to geographic and physician-level characteristics across all PCPs nationwide.
In this study, we quantified associations between PCP characteristics and prescribing of primary care-relevant PIMs for the elderly Medicare population.
Setting and Participants
Using the 2013 to 2015 Medicare Part D Public Use Files (PUFs), we identified PCP prescribers to Fee-For-Service Medicare beneficiaries who were 65 and older. A PCP was defined as a physician who specialized in family medicine, internal medicine, general practice, or geriatric medicine. Due to data availability in PUFs, our PCP sample was restricted to those that had at least 11 claims submitted to Medicare in a given year for both elderly and nonelderly populations.
Outcome
Primary care–relevant PIMs for the elderly were selected from the 2012 AGS Beers Criteria for PIM Use in Older Adults24 based on the likelihood of being prescribed in a primary care setting and cross referenced by 2 independent family physicians. Beers Criteria use a series of different recommendations for PIMs including avoiding its use under certain clinical circumstances or in general. Because we did not have patient diagnostic information available, we narrowed our analysis to Therapeutic Category/Drugs that were recommended to avoid in most circumstances. As our setting of interest was outpatient primary care, we further excluded medications from this list if they were only available in IV formulation or if they were not generally prescribed for the elderly by PCPs based on expert opinion (eg, specialty medications) (Appendix Table A). PIMs that have specific dose requirements or are available over-the-counter were excluded from the analysis. Once we identified the primary care–relevant PIMs, for each PCP, we calculated the PIM prescription rate by dividing the number of PIM drug claims by total drug claims for the elderly patient panel for the year.
PCP Characteristics
Physician age, gender, and medical professional degree were determined using the 2015 American Medical Association Masterfile dataset. Primary care specialty, practice Census region, and Medicare patient panel size were determined from Part D Provider Summary PUFs. Practice size, defined as the number of clinicians in the practice, was obtained from 2015 Physician Compare. PCPs were ordered by practice size and divided into quartiles with those working in the smallest practices grouped in quartile 1 and the largest practices in quartile 4.
Covariates
PCP's patient panel characteristics were determined from Part D Provider Summary PUFs. Patient characteristics included average age of the panel, proportion female, proportion of Medicare patients who were under 65 years of age, average Centers for Medicare & Medicaid Services CMS-Hierarchical Condition Categories risk score of the panel, and whether the panel had higher than sample average proportions of non-Hispanic whites and dual eligibles. PCP's hospital referral region (HRR)–level practice location characteristics obtained from the Dartmouth Atlas of Health Care Data—2011 PCP-to-specialist ratio per 100,000; number of PCPs per 100,000; and 2013 to 2014 price, age, sex, and race-adjusted average Medicare spending—were added using the practice ZIP-5 location provided in the Provider Summary PUFs.
Analysis
We first analyzed the distribution of PIM prescription rates among PCPs from 2013 to 2015. For each year, we divided the PCP prescribers into quartiles by PIM rate and defined those in the highest quartile (Q4) as the high prescriber group and those in the other 3 quartiles (Q1–Q3) as the low-prescriber group. We compared physician, patient panel and practice location characteristics between the high and low PIM prescriber groups. We then used a multivariate regression model to examine whether physician characteristics were associated with PIM prescription rates among PCPs. We included year fixed effects to adjust for time trends in PIM rate and HRR fixed effects to adjust for both observed and unobserved time-invariant market-level characteristics. We also adjusted for patient panel characteristics described above. We used STATA version 14 (StataCorp, College Station, TX) for all statistical analyses.
Results
Our final sample consisted of 111,461 PCP prescribers with 279,858 prescriber-year observations. The top 10 most commonly prescribed PIMs among PCPs in 2015 are presented in Appendix Table C. The top 10 PIMs accounted for 90% of all PIM claims, while 5 out of the top 10 medications were benzodiazepines. During the 2013 to 2015 period, the median PIM prescription rate was 4.1%, while the mean was 4.9% (Figure 1). The PIM prescription rate varied greatly across PCPs with the bottom 10th percentile at less than 0.9% and the top 10th percentile at 8.8%. There were differences in the PIM prescription rate across specialty. General practitioners had a higher PIM rate at 6%, while geriatricians had a lower rate at 3%, relative to internal medicine and family physicians. However, general practitioners and geriatricians made up only 3% of our PCP sample. Figure 1 also shows a steady decline in the PIM prescription rate during the study period across the distribution. There were no notable differences in the downward trends of PIM prescription rates across specialties.
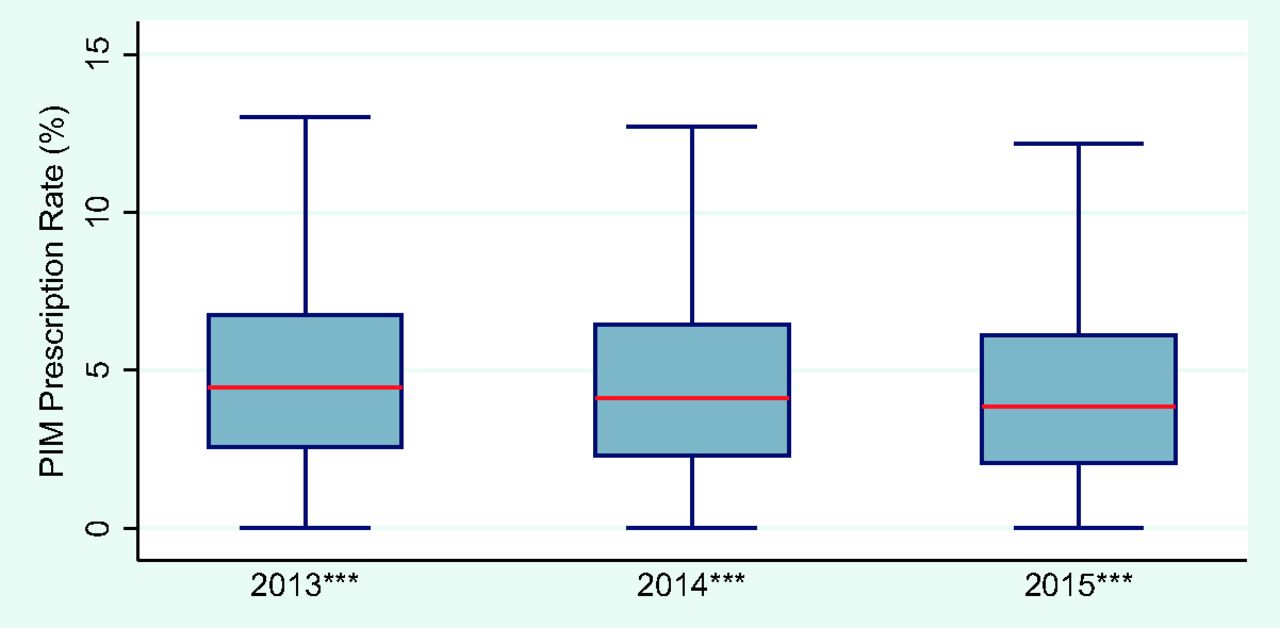
Potentially inappropriate medication prescription rate among primary care physicians in 2013 to 2015. ***P < .001. Note: Data obtained from 2013 to 2015 Medicare Part D PUF and 2015 AMA Masterfile. Potentially inappropriate medications (PIMs) were defined based on primary-care relevant PIMs listed in Appendix Table A.
Tables 1 and 2 illustrate the differences in PCP, patient panel and area-level characteristics between high PIM prescribers and all other prescribers. PCPs in the high-prescriber group had on average 3 times the prescription rate of the low-prescriber group (10.1% vs 3.2%). Most differences in PCP characteristics between the 2 groups were statistically significant but small in magnitude except practice region and practice size. The high-prescriber group were more likely to practice in the South (46% vs 31%) and less likely to practice in the Midwest (27% vs 39%) compared with the low-prescriber group. PCPs in the high-prescriber group were more likely to work in a large practice relative to those in the low-prescriber group (336 vs 252). The 2 groups had similar patient panel and area-level characteristics, except that PCPs in the high-prescriber group were more likely to have a higher-than-average proportion of white patients (77% vs 67%) and a lower-than-average proportion of dual eligibles (26% vs 35%) than PCPs in the low-prescriber group. PCPs in the high-prescriber group had a healthier patient panel (1.3 vs 1.2); however, they were more likely to practice in a higher Medicare spending HRR.
Comparison of PCP Characteristics between High and Low PIM Prescribers
Comparison of Patient Panel and Area-Level Characteristics between Prescribers with High and Low PIM Prescription Rates
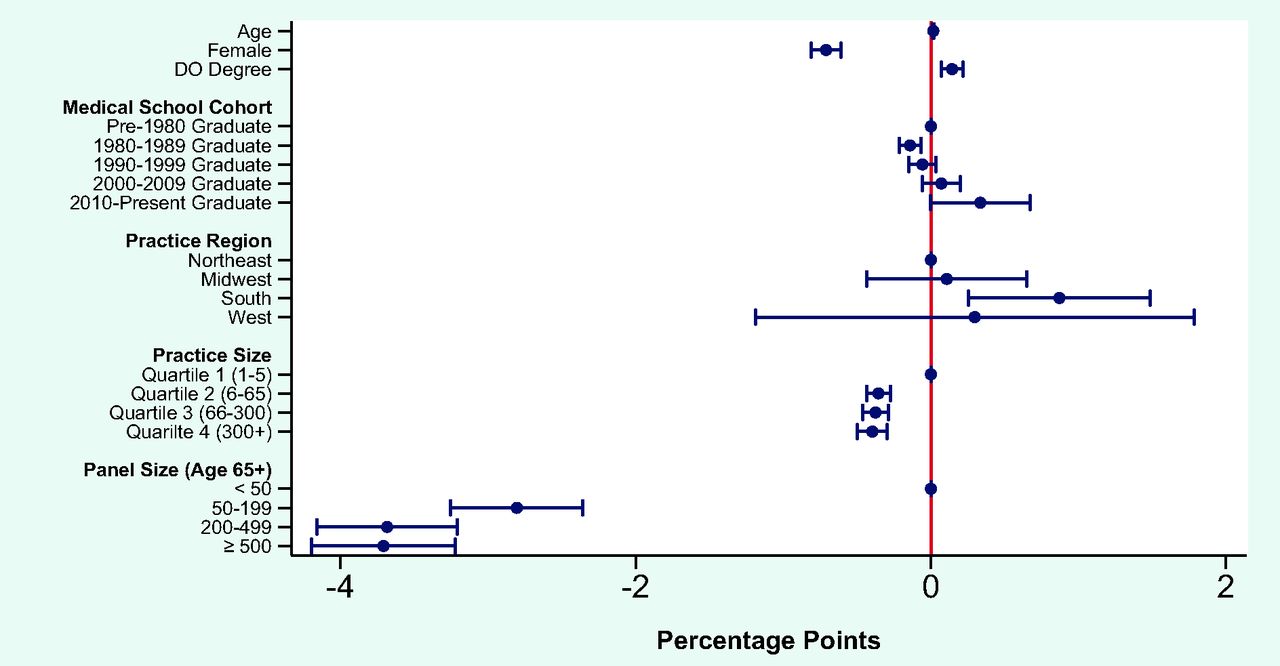
The results from the multivariate linear regression model showed that almost all PCP characteristics were associated with PIM rate once patient panel, time trends, and observed and unobserved market-level characteristics were adjusted for (Figure 2, Appendix Table B). The average PIM prescription rate was 0.71 percentage points lower for female PCPs. PCPs who specialized in internal medicine and general practice had on average a 0.26 and a 0.74 percentage point higher PIM rate, respectively, than those that specialized in family medicine. Patient panel size and practice region had strong associations with PIM rate: PCPs with greater than 500 elderly Medicare patients had on average a PIM rate that was 3.71 percentage points lower relative to those with fewer than 50 patients. Given that the average PIM rate of the study sample was 4.9%, the size of the estimate is nontrivial. PCPs who practiced in the South had on average a 0.87 percentage point higher PIM rate than those who practiced in the Northeast.

Associations between primary care physician characteristics and potentially inappropriate medication prescription rate. Note: Data obtained from 2013 to 2015 Medicare Part D PUF and 2015 AMA Masterfile. Potentially inappropriate medications (PIMs) were defined based on primary-care relevant PIMs listed in Appendix Table A.
Discussion
Our study further validates existing evidence that PIM rates have been decreasing over time (Figure 1);25,26 however, this is the first article to our knowledge to describe provider characteristics associated with PIM prescriptions using a nationally representative dataset. In terms of differences between high-prescriber and low-prescriber groups, our unadjusted results demonstrated notable differences in region and practice size.
When adjusting for patient panel and area-level characteristics, we found Medicare patient panel size had the most sizable association: the larger the Medicare patient panel size, the lower the PIM prescription rate. One reason for this difference may be that physicians with more Medicare patients have more familiarity with guidelines for this population such as Beers Criteria.
Other provider-level characteristics significantly associated with lower PIM rates were gender, degree type (MD vs DO) and primary care specialty. As compared with family physicians, general internists and general practice physicians had higher PIM rates. Although the reason for this is unclear and cannot be answered by this analysis, differences in training could play a role. Surveys of family medicine (FM) and internal medicine (IM) residency programs show that 97% of FM residency programs require training in the nursing home, compared with 65% of IM residency programs.27 Furthermore, FM residents spend a larger proportion of their time training in the outpatient primary care setting, where following guidelines such as Beers Criteria can be part of a routine medication reconciliation process.28 Although there was a trend toward lower PIM rates by geriatricians as compared with family physicians, this is not statistically significant. One notable similarity seen across primary care specialties was the top 10 PIM prescriptions. The most commonly prescribed PIMs across all specialties were similar with half of the top PIMs being benzodiazepines. As seen in other studies analyzing PIM usage, benzodiazepines are commonly identified as being frequently used.29,30 An additional study is necessary to further understand the differences in PIM prescribing behavior between primary care specialties.
Other physician characteristics that are important to note are medical professional degree and gender. It is unclear why DOs had a higher PIM rate than MDs and further studies are required to explain these differences. As for gender, previous studies looking at quality of care provided by women physicians show that they tend to adhere more strongly to guidelines and are more likely to actively involve patients in their care.31 These attributes could explain the associations we are seeing in our data, yet further research should be done to better understand why this variability exists.
In terms of practice location, we found that, compared with PCPs who practiced in the Northeast region, those who practiced in the South had on average a higher PIM prescription rate. This is consistent with the regional trend observed among Medicare beneficiaries in a prior study with the South having the highest PIM rates.32 This pattern has been consistent over time.33,34 Certainly, practice patterns can be regional and can be dictated by local availability of safer alternatives, having pharmacists integrated in clinical teams or other external factors. Another PCP practice characteristic that was associated with PIM prescription rate was practice size, with PCPs in larger practices having on average a lower PIM rate. This may be due to larger practices having the resources for infrastructure changes that could facilitate safer prescribing pattern, such as electronic medical records with clinical decision support systems that offer prescription alerts.
Our study has several important limitations. First, Medicare Part D PUFs only allows us to identify a prescriber if they have prescribed a particular drug greater than 10 times. There remains the possibility that we are underestimating PIM prescription rates for those who prescribe relatively infrequently and those who have relatively smaller Medicare patient panels. Second, given that not all Medicare beneficiaries are enrolled in Part D, our results may not be generalizable to those who have a relatively high proportion of Medicare patients with no Part D drug plans. However, since most Medicare beneficiaries are enrolled in Part D during our study period, this limitation is unlikely to have affected our results.35 One thing to note is that we cannot distinguish whether the drug claim came from a standalone or Medicare Advantage–Prescription Drug Plan in our data. However, given that federal regulations require a certain number of drugs be covered per drug class36 and that our analysis involved most commonly prescribed PIMs and all medications within each drug class, our findings are unlikely to have been driven by subtle differences across drug plan formularies. Third, due to the nature of administrative claims data, the prescription data included is limited to dispensed prescription medications. Therefore, we cannot account for unfilled prescriptions or over-the-counter PIMs that may have been recommended by physicians since these are purchased without a prescription. Fourth, we did not have patient-level health information to fully adjust for the health distribution of each patient panel. Although we adjusted for the average health status of a patient panel using Centers for Medicare and Medicaid's cost-based risk score, the distribution of health conditions would affect the PIM prescription probability and may be correlated with PCP characteristics. Finally, it is important to note that our findings do not translate directly into unsafe prescribing practice behavior. The AGS Beers Criteria are simply guidelines aimed to improve medication safety for the elderly. There are many reasons why a provider may safely prescribe a PIM including the fact that some PIMs can be prescribed for a legitimate diagnosis or as part of a deprescribing plan. We did not have patient-level diagnostic information nor medication history to assess these potential reasons behind PIM prescribing.
One of the strengths of this study is the inclusion of a national sample of PCPs providing prescription drugs to Medicare patients, which provides a more comprehensive representation of primary care prescribing patterns from 2013 to 2015. This is also the first study to analyze U.S. PCP prescribing patterns based on PIMs specific to primary care. The study findings highlight potential physician characteristics that may be correlated with PIM prescribing in the primary care setting. This has clear clinical implications. Given the cost of complications and adverse events related to PIMs in the outpatient setting, it is important that we determine factors that promote safe prescribing behavior. Identifying physician factors can guide educational and clinical interventions aimed at improving medication safety for the elderly by reducing the variation in care and overall PIM use.
Acknowledgments
We thank Robert Baillieu, MBBS, MPH, and Elizabeth Wilkinson, BA, for their assistance.
Appendix
Primary Care to Relevant Potentially Inappropriate Medications from Beers Criteria*
Associations between Primary Care Physician Characteristics and Potentially Inappropriate Medication Prescription Rate*
Top 10 Potentially Inappropriate Medications by Primary Care Specialty in 2015*
Notes
This article was externally peer reviewed.
Conflict of interest: None declared.
Funding: The authors received no financial support for the research, authorship, and/or publication of this article.
To see this article online, please go to: http://jabfm.org/content/33/4/561.full.
- Received for publication September 4, 2019.
- Revision received February 17, 2020.
- Accepted for publication February 24, 2020.
References
In this issue


Jump to section
Related Articles
Cited By...
- Challenges and barriers to physician decision-making for prescribing and deprescribing among patients with multimorbidity in eastern Chinas primary care settings: a qualitative study
- Ambulatory Medication Safety in Primary Care: A Systematic Review
- Low-value pharmaceutical care among Dutch GPs: a retrospective cohort study
- Medications, Medicating, and Medicated--When, Where, and How--Opioids and Others